Timeframes
Compare the time scales and the combination of candles.
What does timeframe mean?
Timetown - the hour interval of one candle. At 15m each candle represents 15 minutes, at 1H - an hour, at 1D - a day. This is the scale of graphics, and it does not require to keep the deal just as much time.
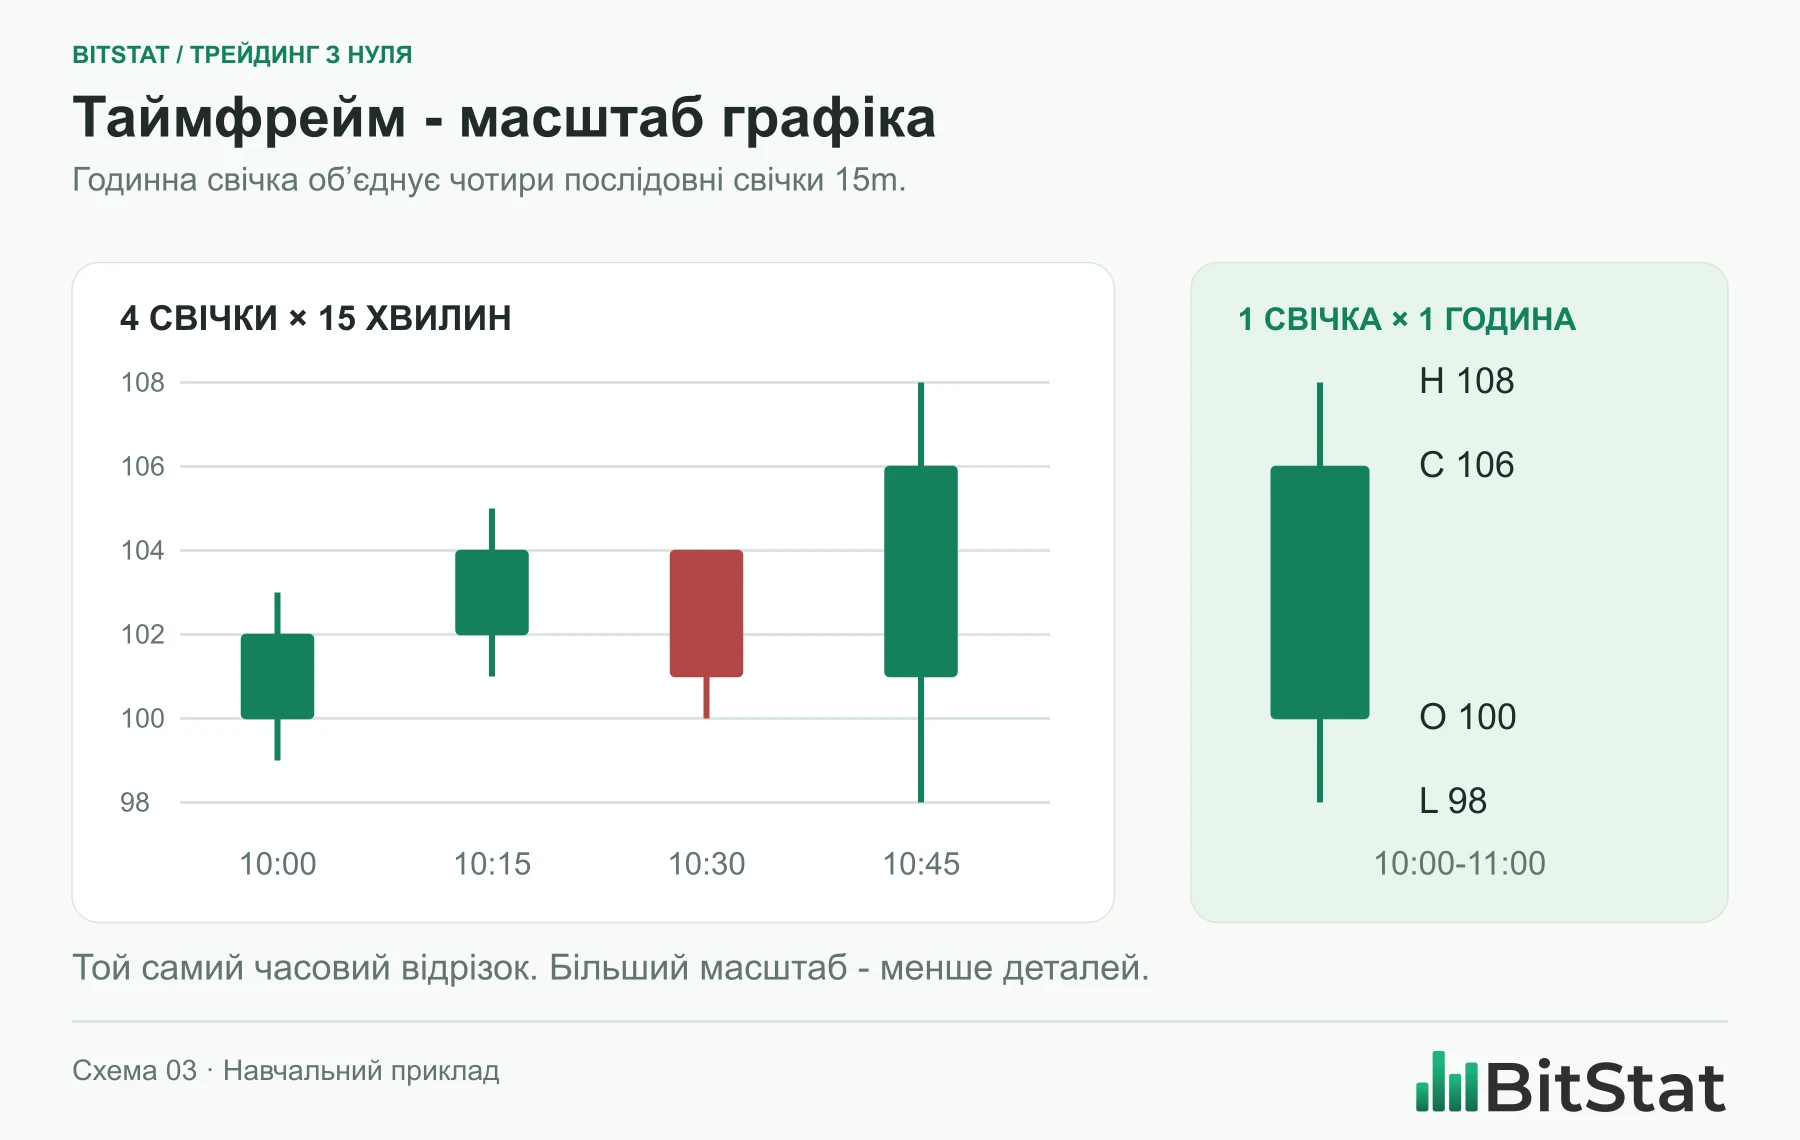
On the scheme four candles of one hour have common time limits with an hour candle. Its opening is taken from the first candle, closure - from the last, maximum - the largest of the four, minimum - the smallest.
What changes when the scale is overwhelmed
When you move from 15m to 1H, the data grouping changes. Small movements remain inside a larger candle but are no longer shown separately. Therefore, the hourly schedule gives a more compact review and a smaller scale allows you to consider details of a particular cut.
Time frame and visible period of history are different concepts. On 1H you can show a few days, not just one hour. The change in scale by the mouse's collar also does not necessarily change the duration of the candle: sometimes it only increases the image.
We make a clock in four parts.
Let four finished candles of 15m have the following data:
| Part of the hour | Open | High | Low | Close |
|---|---|---|---|---|
| The first | 100 | 103 | 99 | 102 |
| The other | 102 | 105 | 101 | 104 |
| Third | 104 | 104 | 100 | 101 |
| The Fourth | 101 | 106 | 100 | 105 |
The hour candle: O = 100, H = 106, L = 99, C = 105. We do not mediate the opening or maximum. We take the beginning of the first part, the end of the last and the extreme values of the whole group.
This example provides full data and the same time limits. On a real schedule, take into account trading sessions and source settings: you should not automatically expect 24 hour candles for every calendar day of any tool.
Minipractic
Compare the OHLC at 1H with four corresponding candles 15m. If numbers differ, check if the tool, source and time limits match. Do not compare the completed hour with the one that is still forming.