Відстежуй головне
Об’єднуй угоди й результати акаунтів у цілісній картині.
Веди журнал угод, аналізуй результати й будуй повторюваний процес в одному сфокусованому просторі.
Почати безкоштовно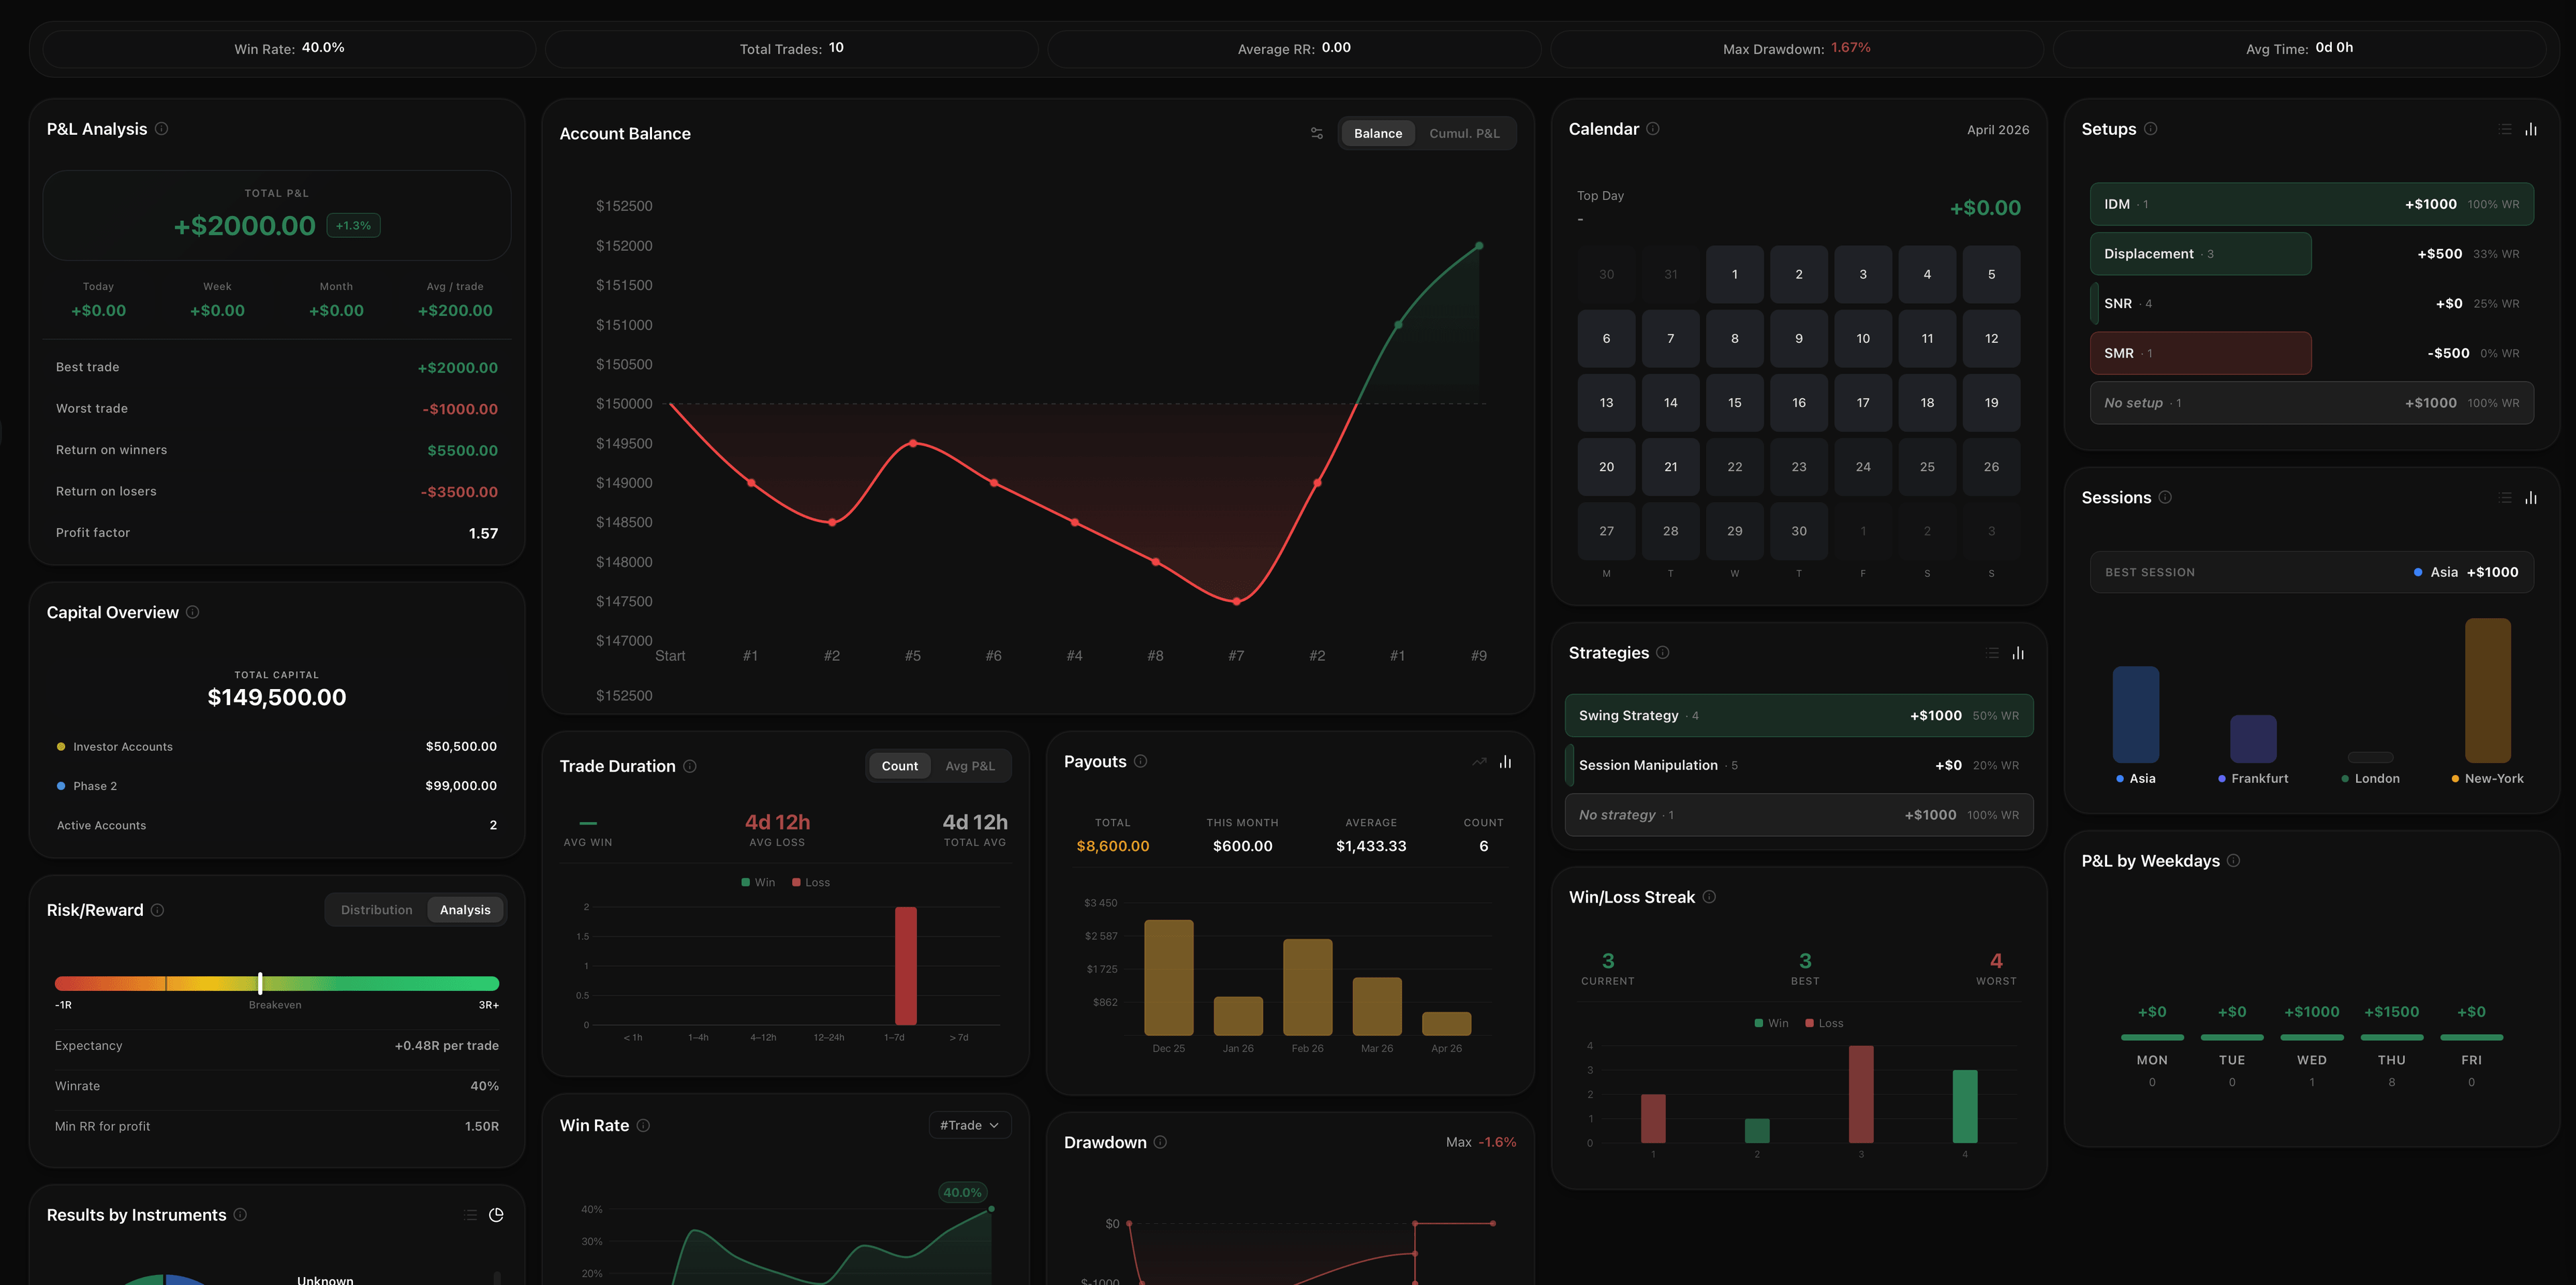
 MetaTrader 5
 Binance
 Bybit
BybitПеретвори розрізнені результати на зрозумілий процес аналізу після кожної торгової сесії.
Об’єднуй угоди й результати акаунтів у цілісній картині.
Зберігай точки входу, контекст, нотатки, стратегії та сетапи разом.
Порівнюй баланс і результати між усіма своїми акаунтами.
Знаходь закономірності у P&L, сесіях, інструментах і risk-reward.
Використовуй однаковий процес аналізу й закріплюй кращі звички.
Робочий простір, що зростає разом із твоїм процесом та акаунтами.
Кожен інструмент BitStat показує інший зріз того самого торгового процесу — без втрати фокуса.
Переглядай ключові метрики: P&L, баланс, просадку, сесії, стратегії та результати календаря.
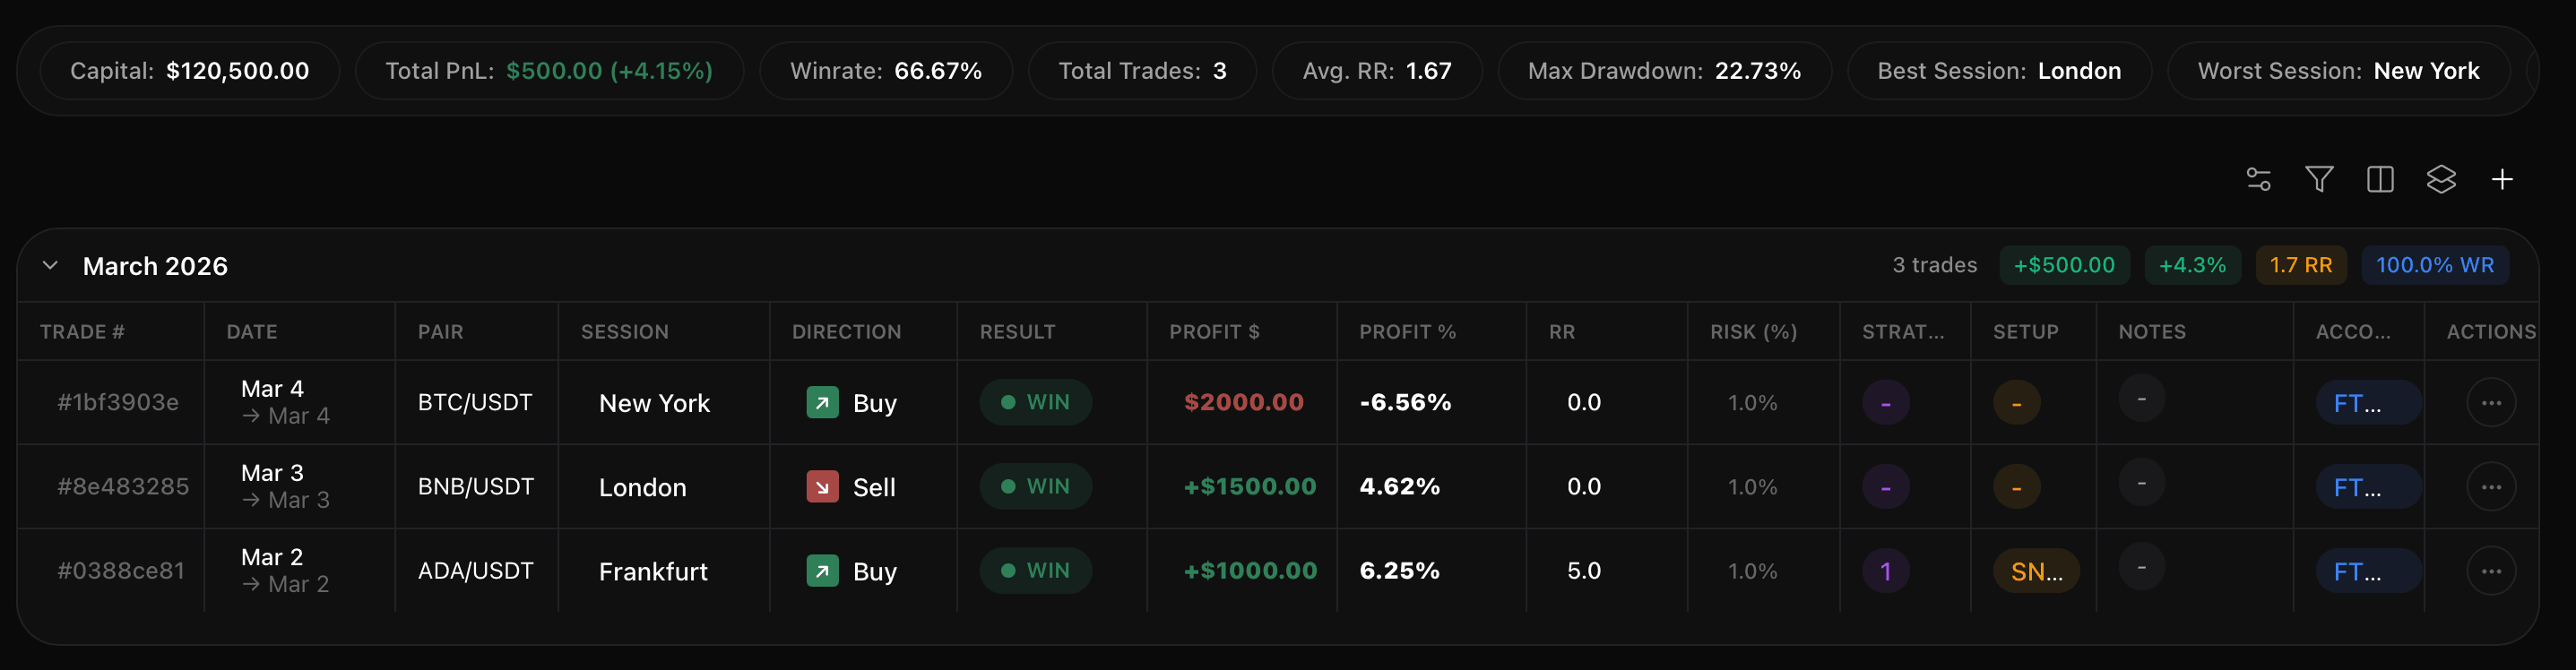
Зберігай усі угоди в одному місці з результатом, напрямком, ризиком, стратегією, сетапом, акаунтом і нотатками.
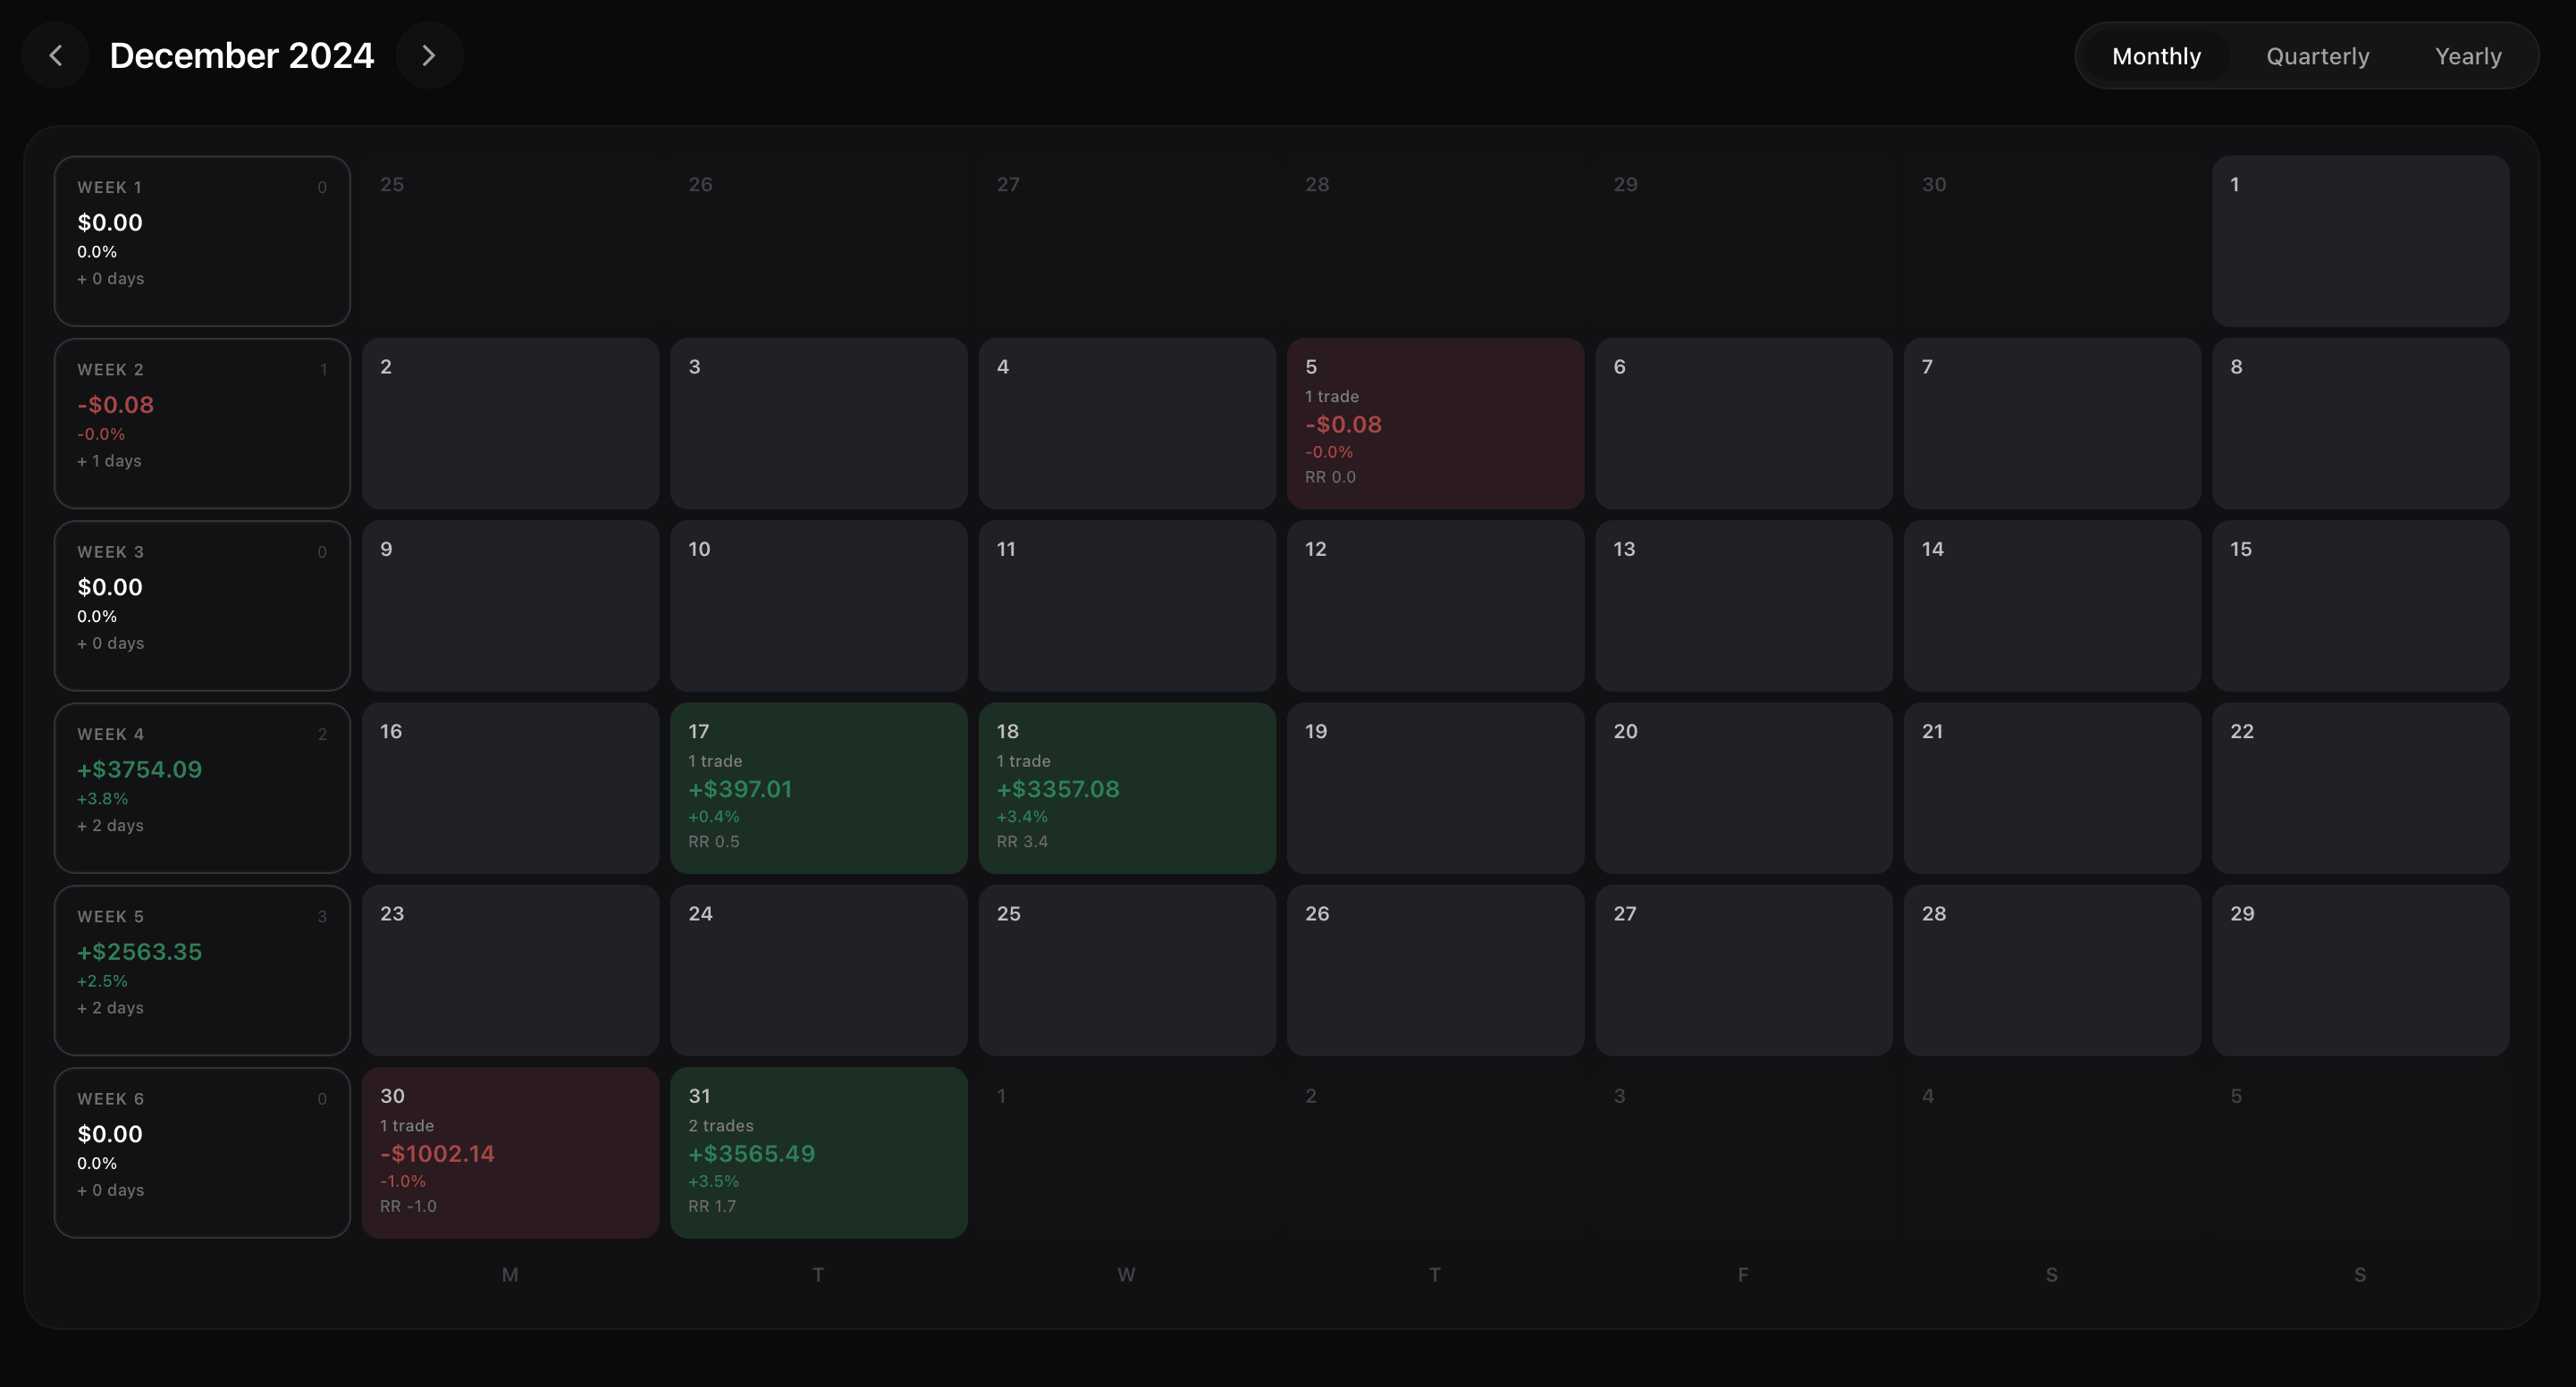
Одразу бач прибуткові й збиткові дні та перемикайся між місячним, квартальним і річним виглядом.
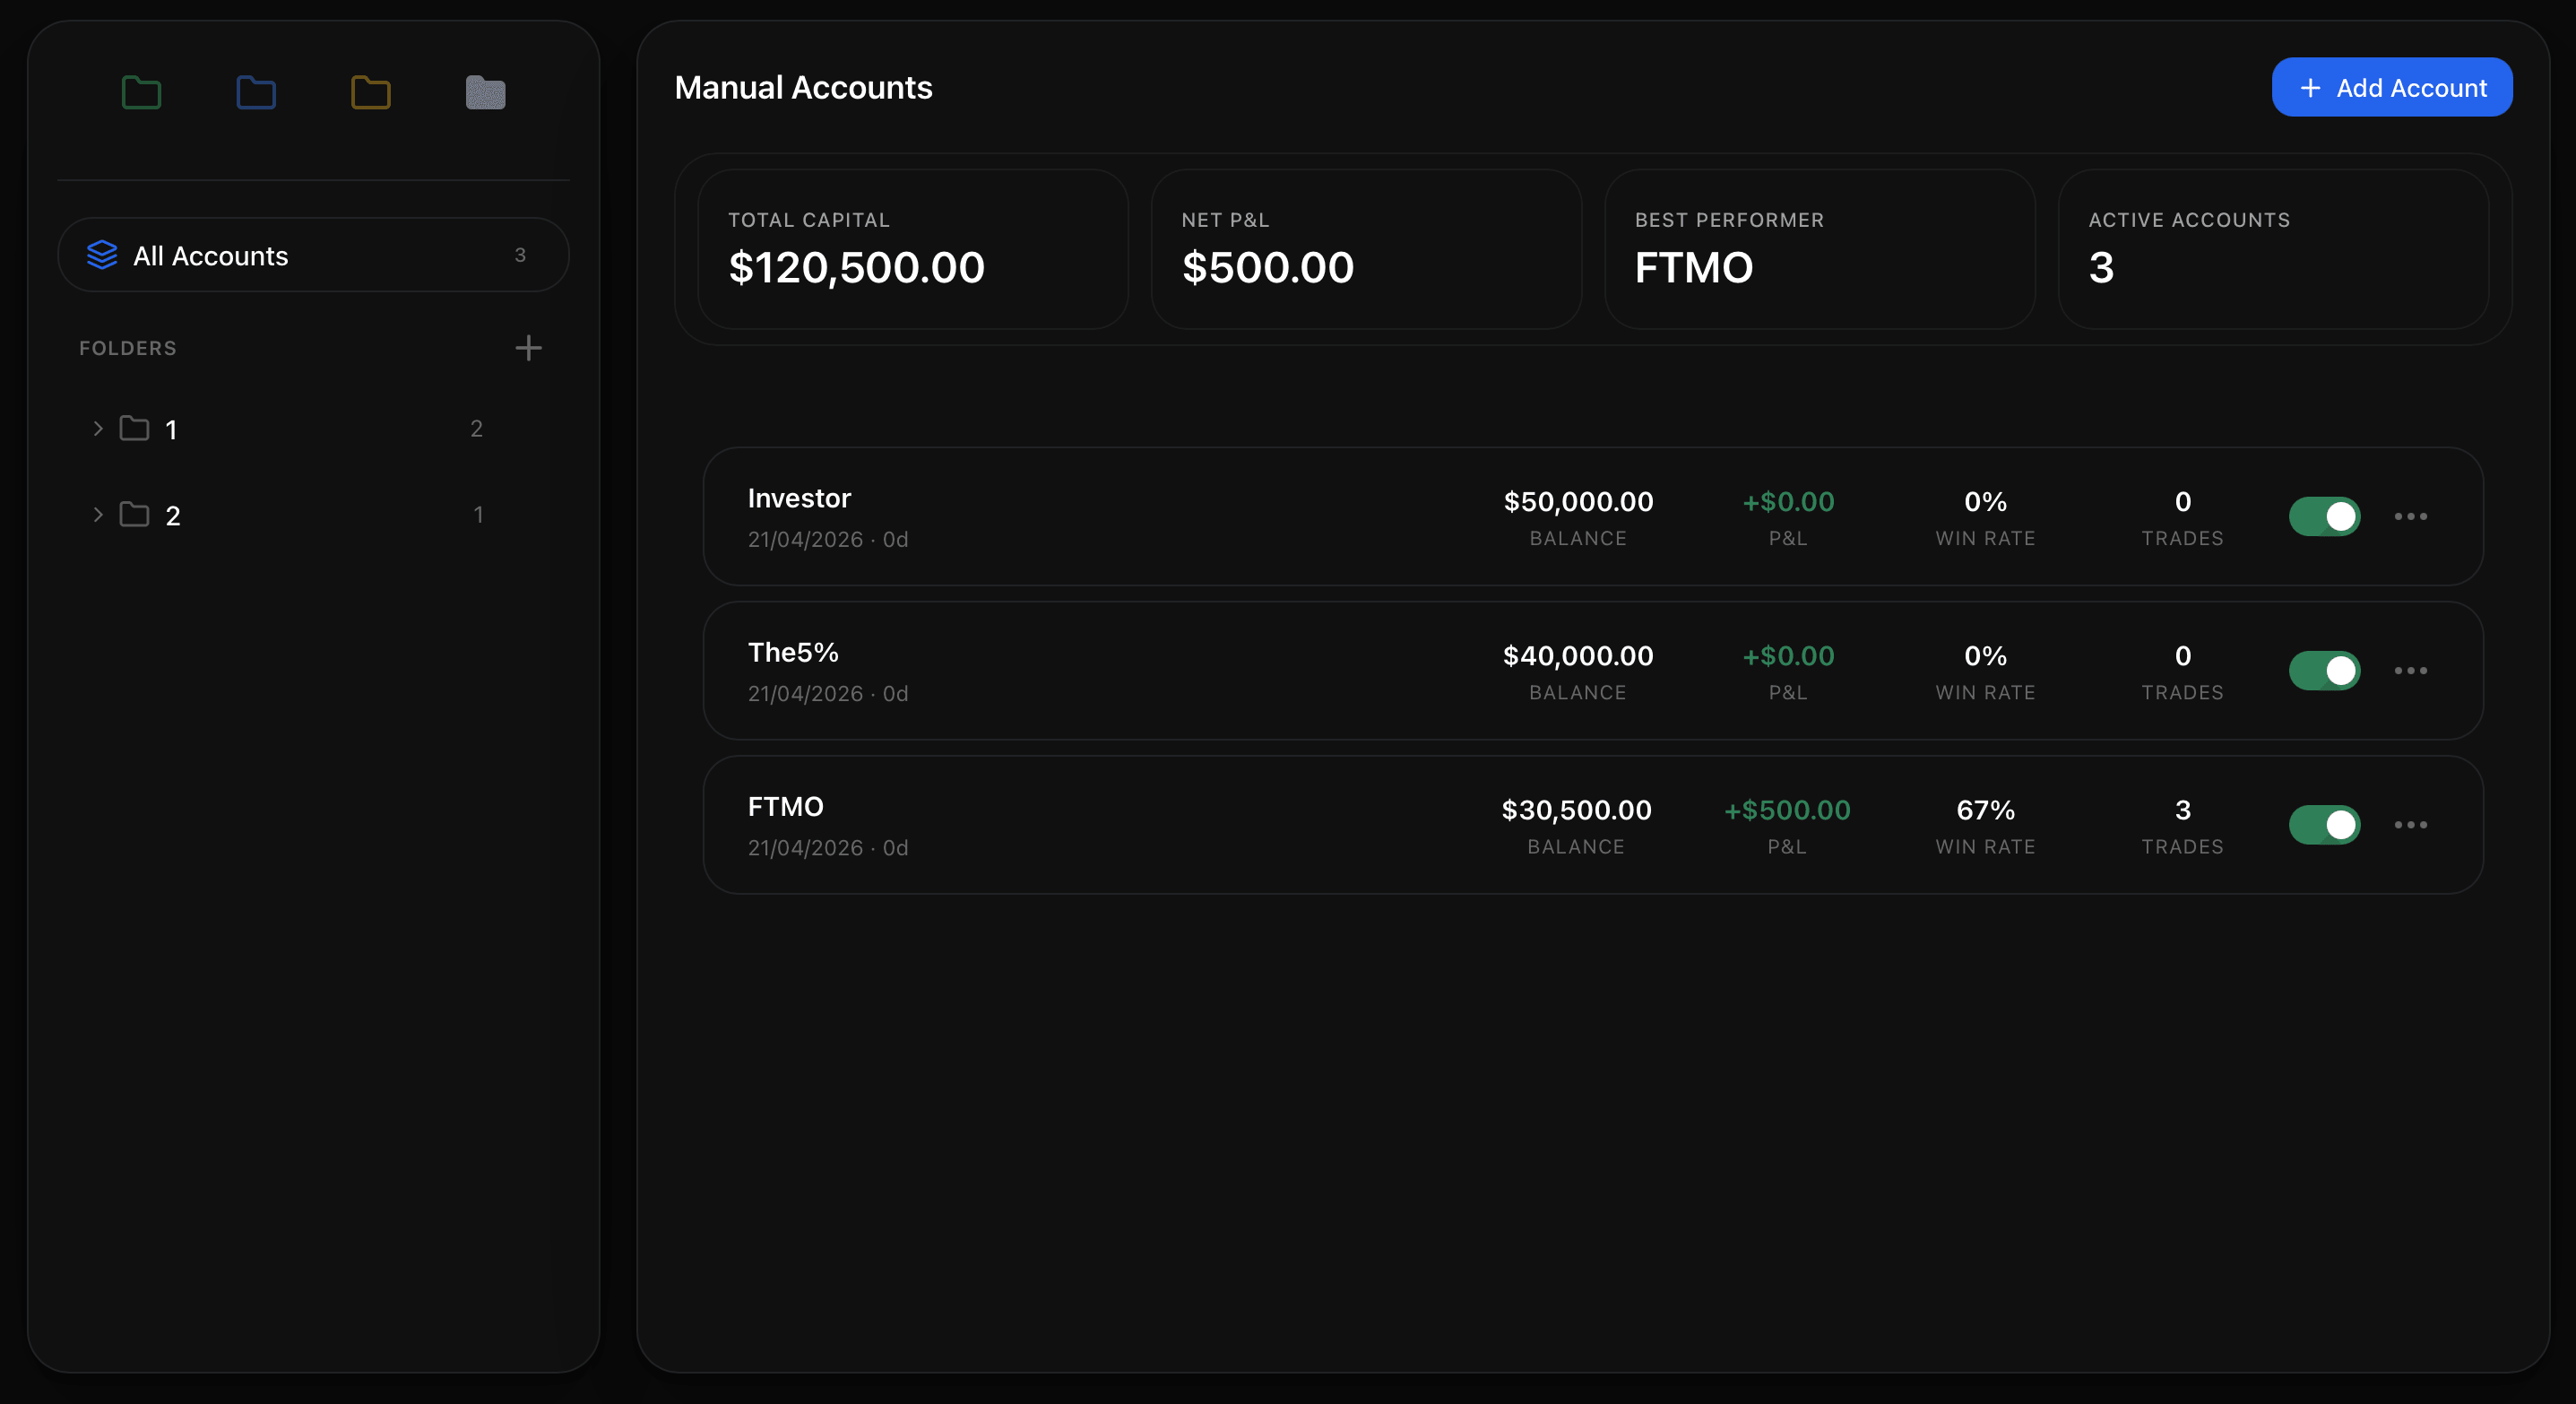
Керуй підключеними й ручними акаунтами, групуй їх у папки та порівнюй баланс, P&L, win rate й активність.
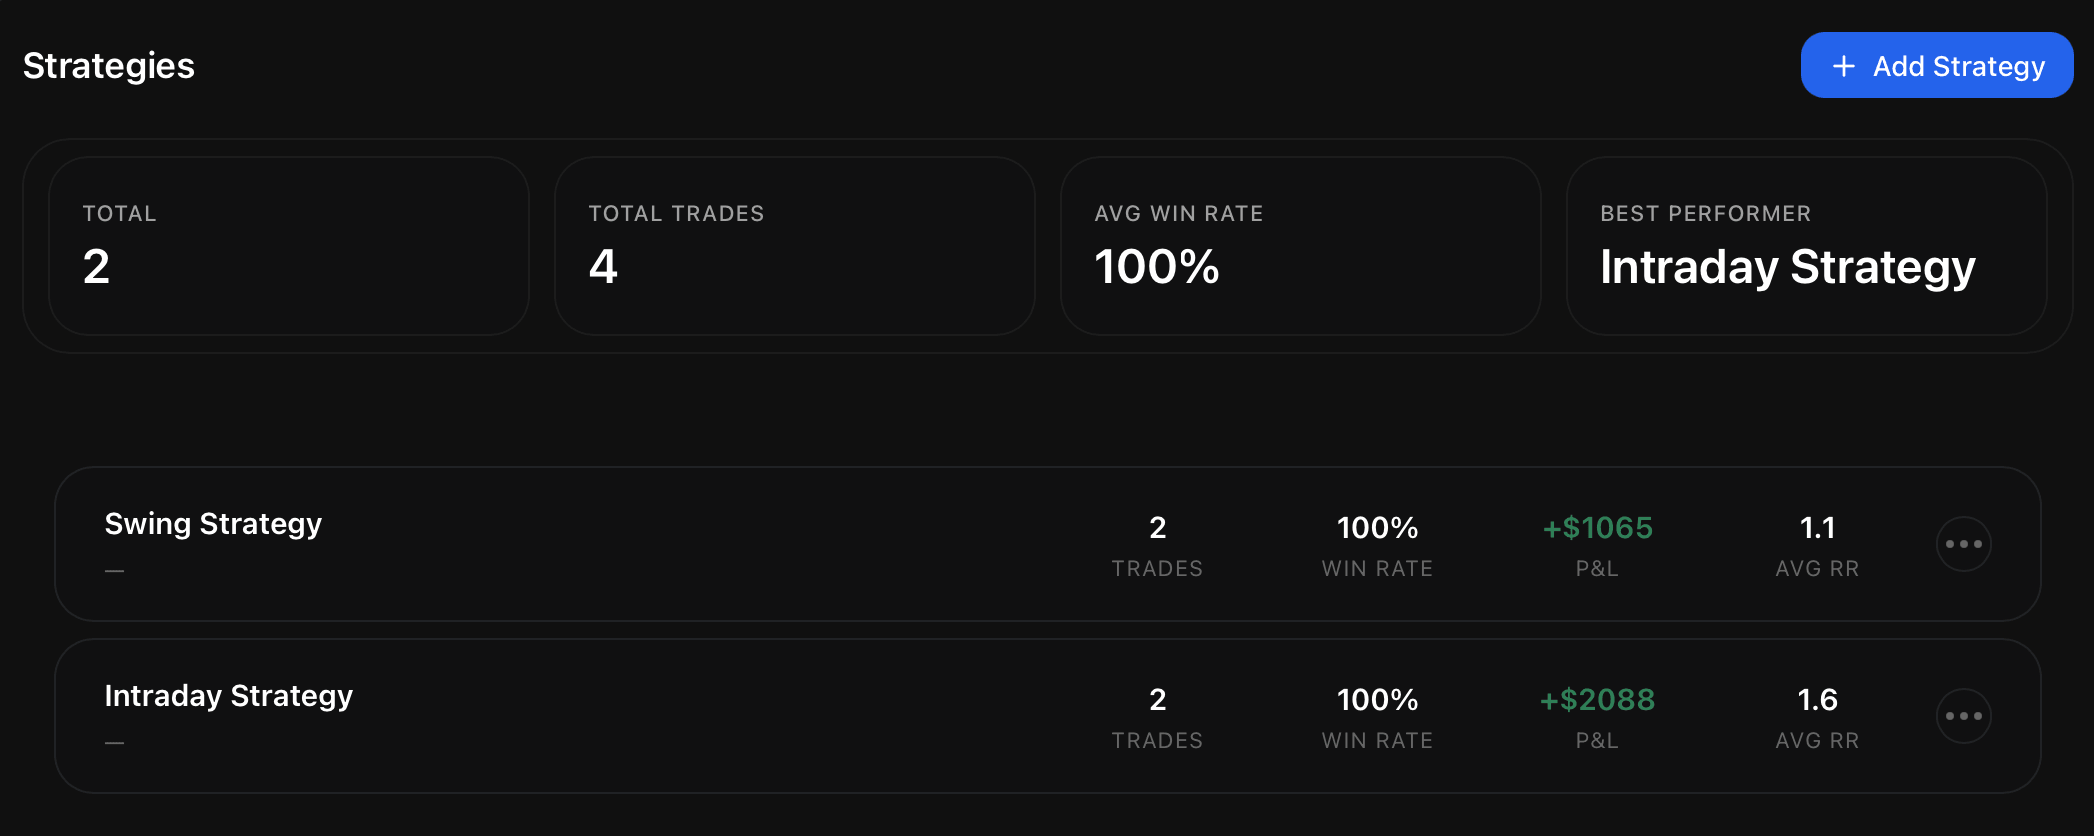
Групуй угоди за торговим планом і моделлю виконання, а потім порівнюй win rate, P&L, середній R:R і кількість угод.
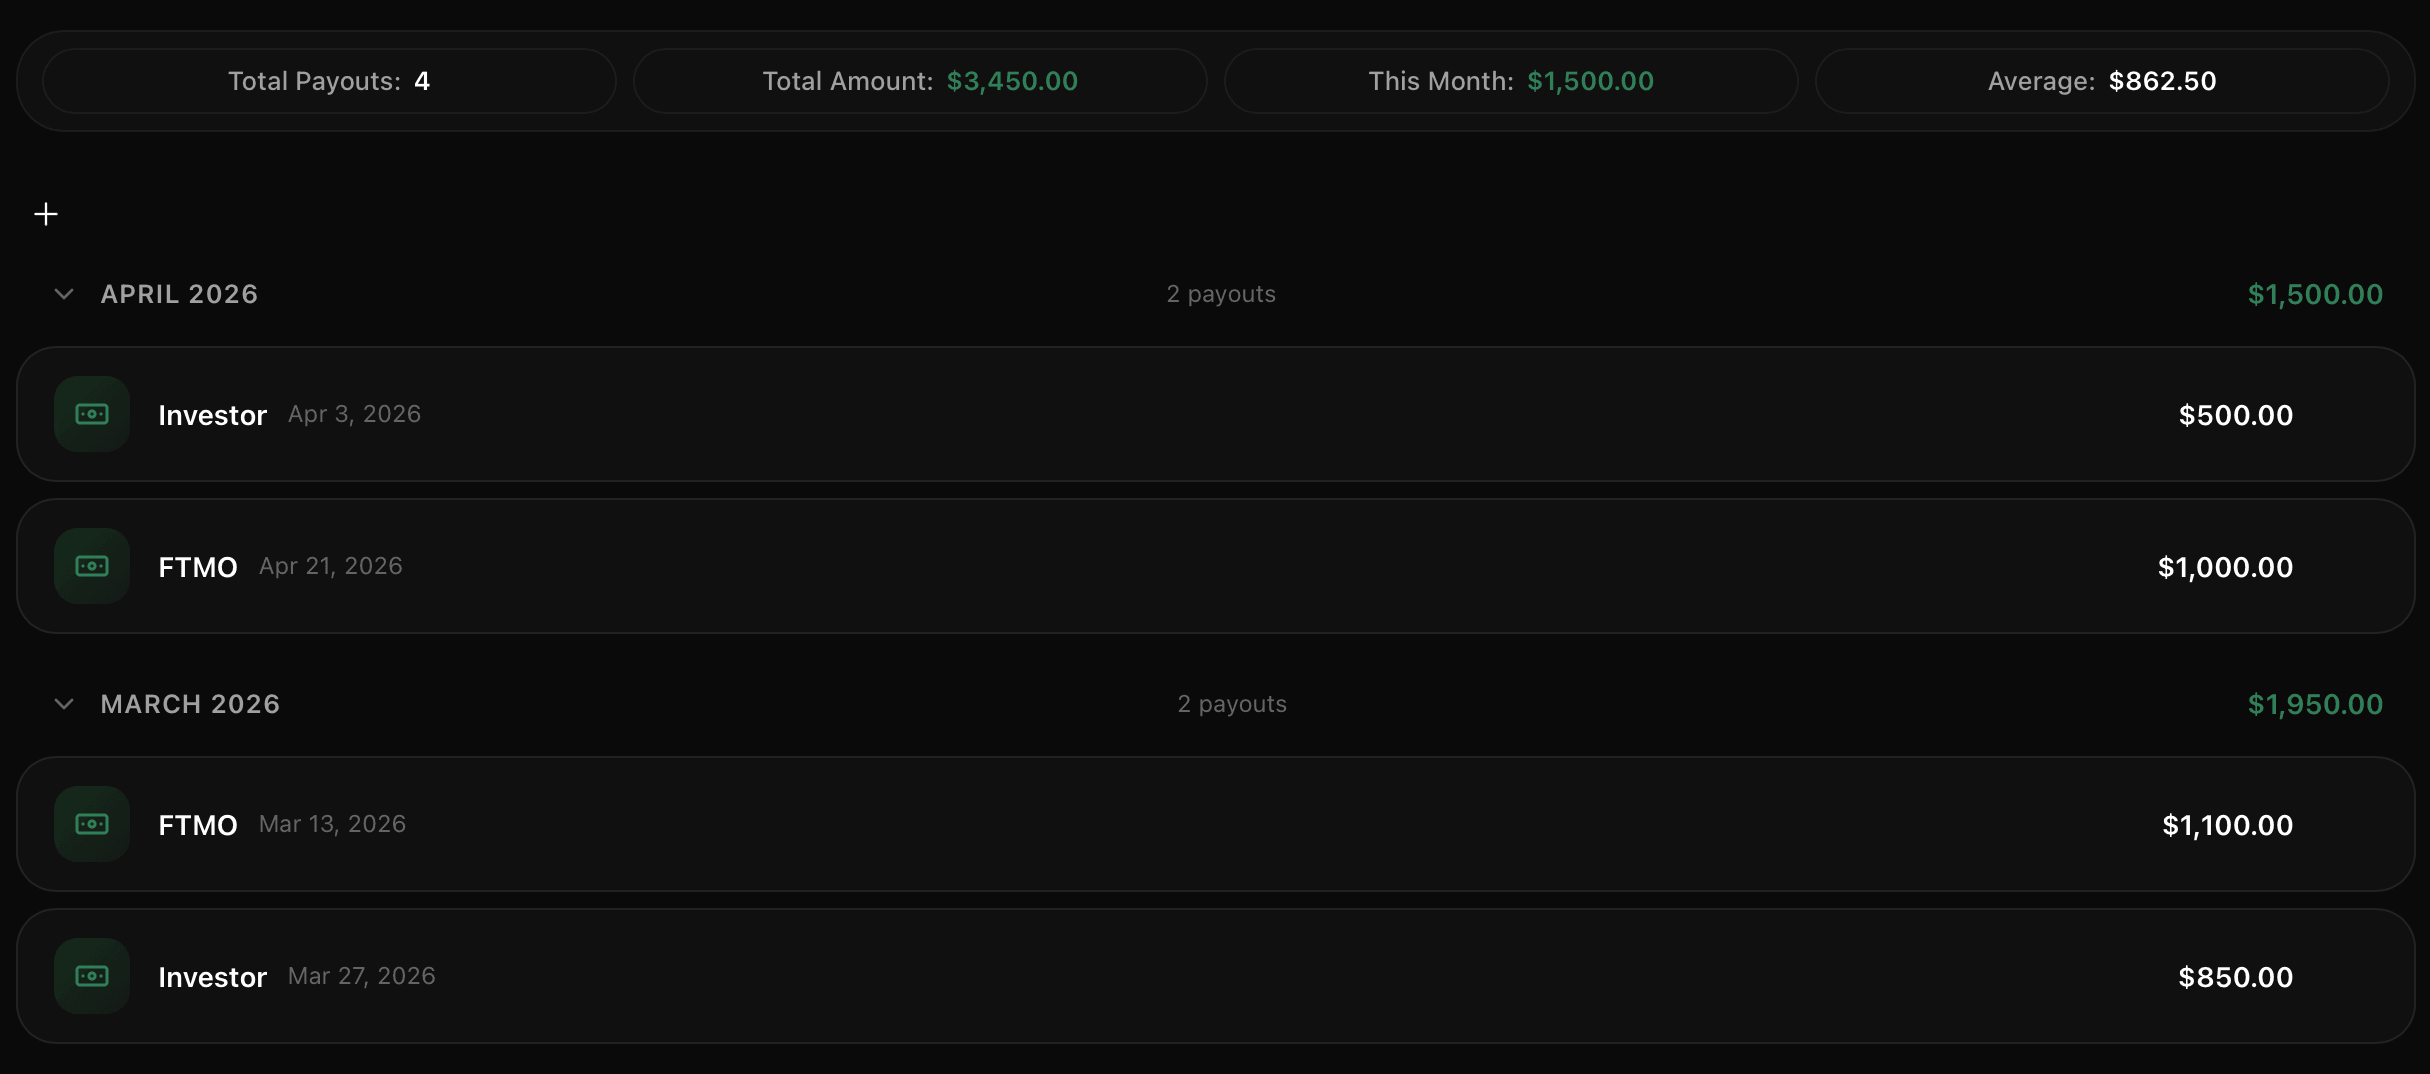
Тримай історію виплат, прив’язку до акаунтів, суми за місяць і прогрес поруч із торговими даними.
Створи профіль і організуй перший акаунт за кілька хвилин.
ПочатиПідключи MT5, Binance або Bybit за зрозумілими інструкціями.
Читати гайдиРозвивайся разом із трейдерами, які цінують процес і системність.
Відкрити DiscordОбери кількість акаунтів і доступ до функцій під свій процес.
Порівняти планиКоротко про дані, акаунти, безпеку та безкоштовний доступ.
BitStat — це торговий журнал і робочий простір аналітики для угод, акаунтів, стратегій, календаря та виплат.
Можна підключити MetaTrader 5, Binance і Bybit у read-only режимі або додати ручний акаунт та угоди.
Так. Ліміт залежить від тарифу, а результати можна фільтрувати й порівнювати між доданими акаунтами.
Для підключень використовуються read-only доступи. BitStat не потребує права торгувати або виводити кошти.
Так. Безкоштовний план дає базові інструменти журналу й аналітики, щоб налаштувати свій процес.
Збери угоди, рішення й результати в одному робочому просторі.